
Paying For Performance You’re Not Getting?
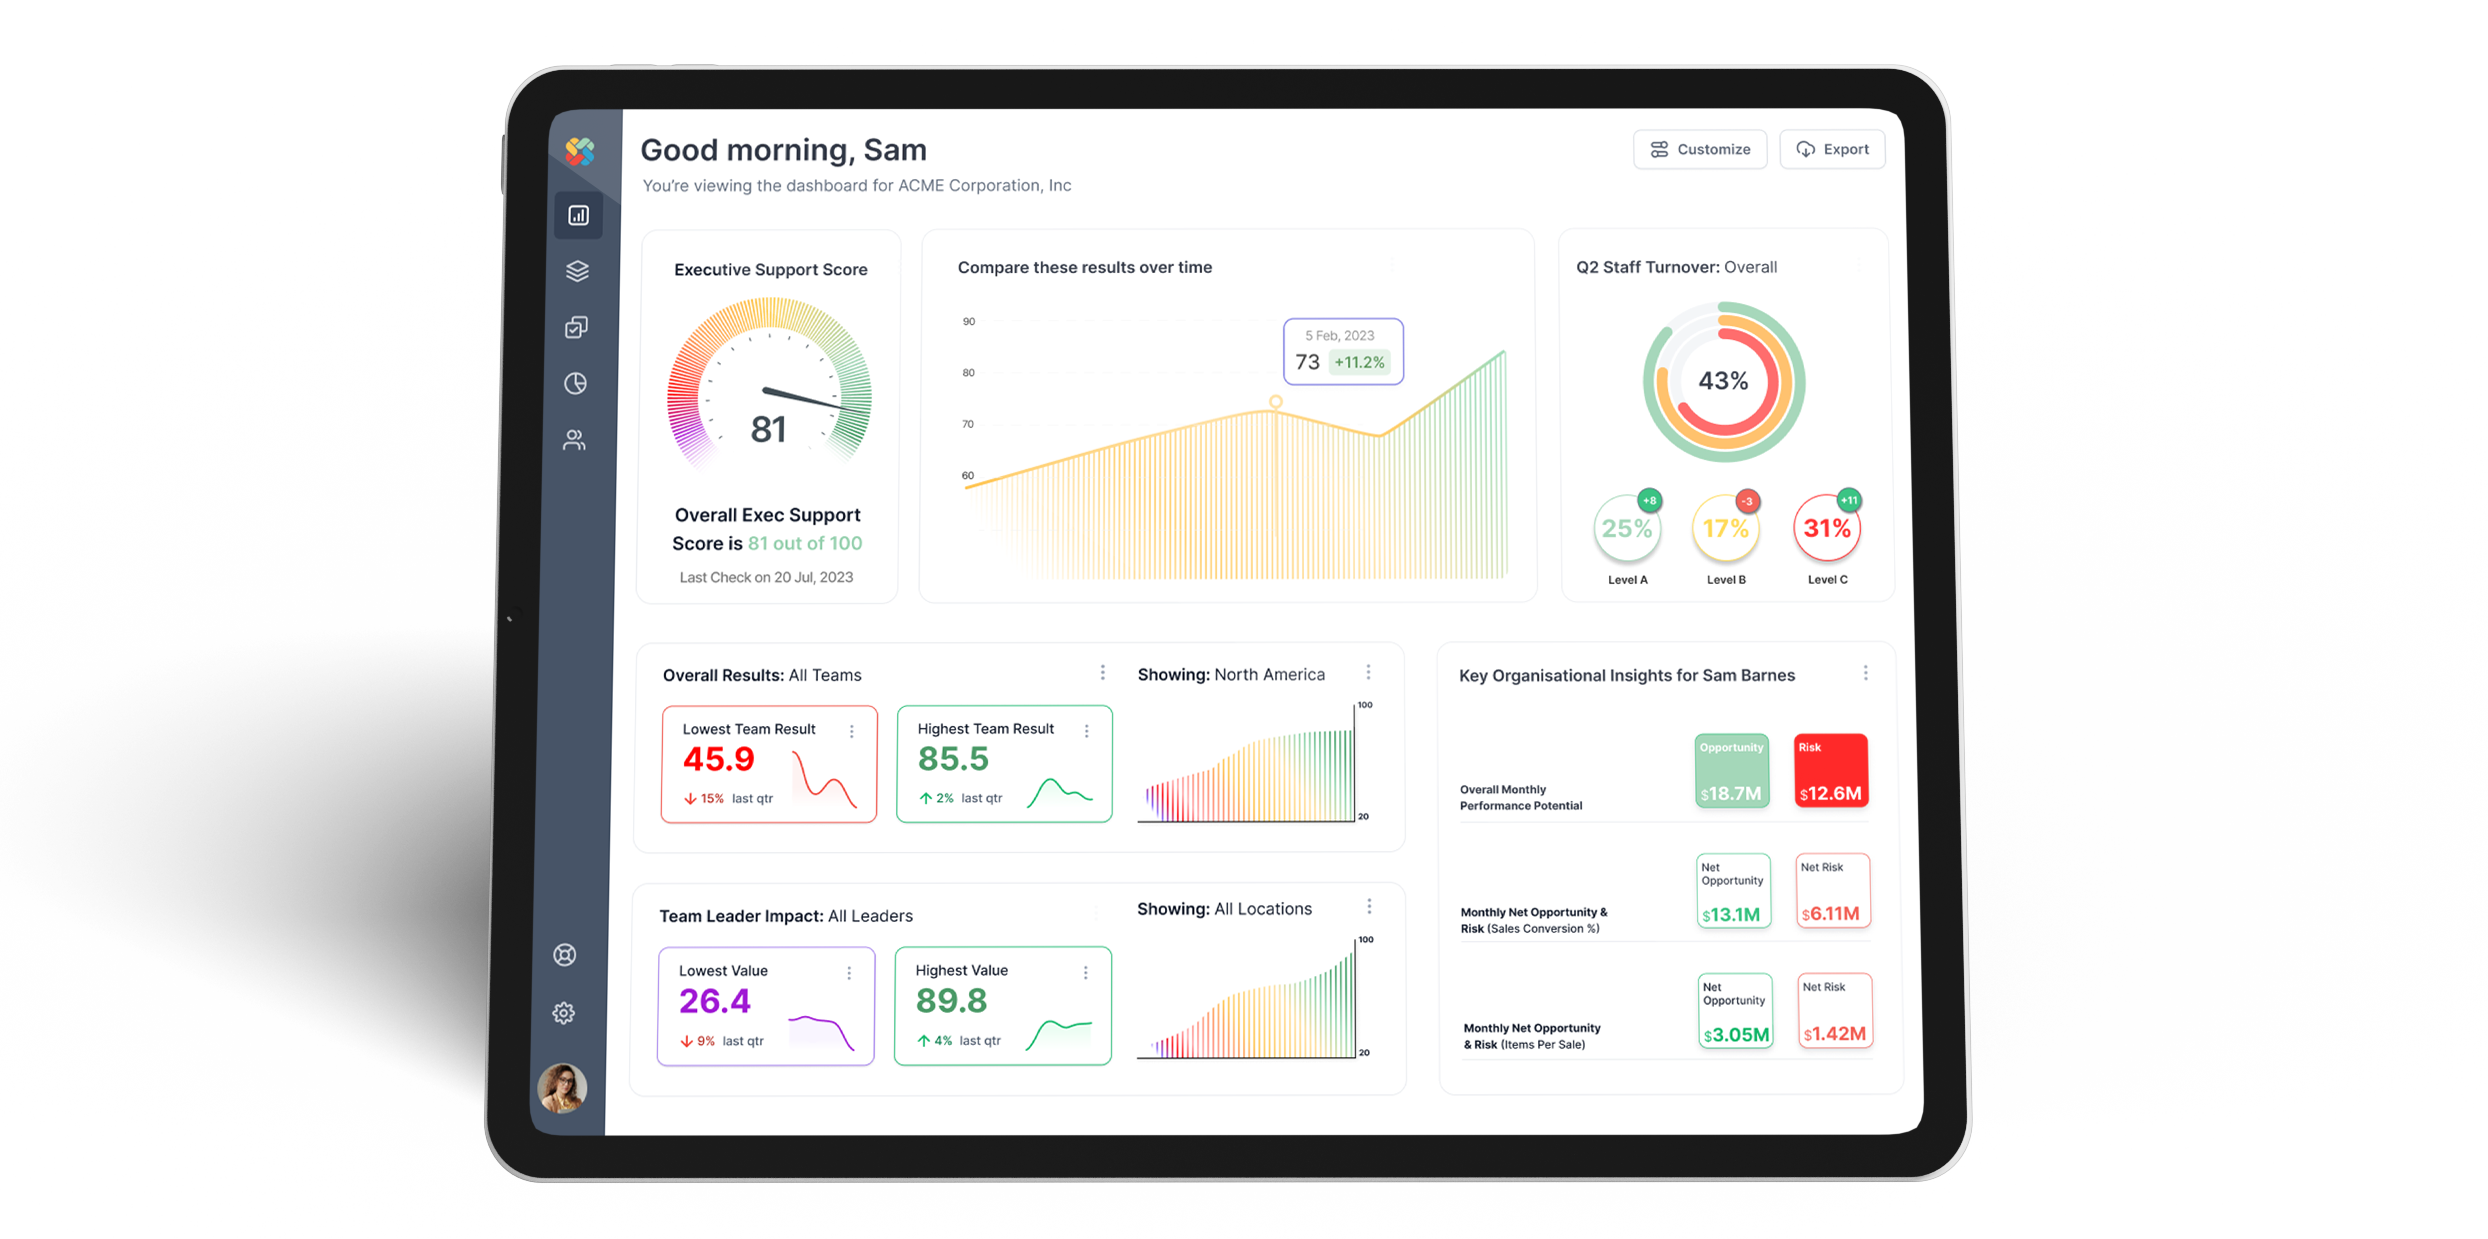
Conductor helps leaders see how effectively their organisation is turning human potential into performance — and where it’s getting stuck.
Discover Your Hidden Performance Potential
THE PROBLEM
What performance data doesn’t show
Most organisations measure productivity, utilisation, and cost efficiency, but none of those explain why effort isn’t translating into consistent output.
That’s where Conductor works.
We measure the gap between how much people could contribute and how much the system lets them.
We help leaders see how effectively their organisation is turning human capacity into performance
Every CFO & COO knows the feeling, leaders say they’re teams are busy, yet output is sluggish…and margins are declining.
Hidden Performance Gaps
People aren’t the problem.
The real limit on performance isn’t hours or headcount — it’s the willingness and capacity people have to think clearly, decide confidently, and contribute fully.
When these are drained by confusion, unfairness, inflexibility, fear and anxiety, or poor communication, performance drags long before engagement or metrics reveal it.
Using Conductor, Leaders can quantify the gap between what your people could deliver and what your system actually allows them to.
Higher Performance = Willingness × Capacity
Leaders aren’t just managing workload — they’re managing the human operating conditions that determine whether people show up and perform fully.
“It’s not about pushing harder — it’s about removing the friction that stops willingness and capacity from turning into performance”

We look for the hidden gaps between your best team and average teams

Then we show you how to replicate that across the business.

The result? Less variance, more consistency, and better performance without adding headcount.
Use the calculator below to see how much hidden potential might be sitting inside your organisation right now.
How to Calculate Your Hidden Performance Potential
Select your annual revenue band and model how small improvements in utilization, efficiency or conversion, can change your financial yield.
Each KPI uses pre-set operating elasticity, drawn from real industry benchmark data.
See how Conductor-optimised teams outperform.
Improving psychological safety increases performance capacity and willingness — meaning your people convert more effort into revenue, amplifying every operational improvement you make.

Case Study
A national fashion retailer asked Conductor to help explain why overall revenue growth was stalling, despite continued traffic, consistent pricing, and no significant change in product mix.
What We Found
Half of the network was functioning at less than 70% of the conversion capacity already proven possible within the same brand.
Only 1 in 6 operate near the top band
50%-60% of paid human capacity was being affected by friction - not market demand
Variance wasn’t explained by location, range, or promotions.
The difference lay in operating environment — clarity of goals, support to contribute, and leadership practices.
Outcome
Over 90 days revenue increased by 47%, sales conversion improved by 14.5% and one-quarter of the network moved to a higher sales conversion band - 33-62%.
Revenue elasticity showed every 1% improvement in conversion delivered a 3.3% increase in revenue. Outperforming typical retail benchmarks (2–3%).
Staff weren’t just making more sales, they were converting sales at a higher value.
We built Conductor because we believe organisations can do extraordinary things without exhausting the people who make them possible.
Our job is to help you find that balance. The place where people and performance move together.
HOW TO START
Begin where you are…
We’ll help you see your Performance Potential, find where the system slows people down, and show you how to free it.